

Analytics
Copy Link
Analytics gives you a clear overview of overall engagement and activity levels across your organisation.
By collecting data from Tasks, Issues, Checklists, and Signals, Analytics helps you understand how stores are working with StoreSprint on a daily basis. This makes it easier to identify highly engaged stores, spot units that may require additional support, and follow up on how routines, processes, and initiatives are being adopted throughout the organisation.
Did you know?
You can also access a quick status overview of published Checklists, Signals, and Tasks directly from the organisation view in the mobile app.
Perfect for Regional Managers and other leaders who spend a lot of time in stores and want an up-to-date status overview before a store visit, follow-up meeting, or coaching conversation.

Checklist Analytics
Under Centralised Checklists, you can get a quick overview of all published checklists and how well they are being followed across your organization.
For each checklist, a status indicator is displayed based on the 7 most recent scheduled occasions:
Adopted – The checklist is being used consistently with high compliance.
Engaged – The checklist is being used, but there is room for improvement.
Needs Attention – The checklist has low compliance and should be reviewed.
The status is calculated based on the completion rate of the last 7 scheduled occasions. For example, if a checklist is scheduled daily, the analysis will be based on the previous week's completions.
You can also see:
Active Issues – Number of open issues reported through the checklist.
Status – Shows compliance for the latest scheduled occasion and how many units have completed the checklist. For example, a status of 6/8 means that 6 out of 8 units have completed the checklist for the latest scheduled occasion, while 2 units have not yet completed it.
By clicking on a checklist, you can access a more detailed analysis at the unit level.
Analytics
By clicking Analytics in the top-right corner, you gain access to trend analysis for the selected checklist.
Here you can track performance over time and analyze results for the past week or month.
Available metrics include:
Reported Issues – Number of reported issues.
Resolved Issues – Number of resolved issues.
Tasks Completed – Number of completed tasks linked to the checklist.
Checklist Occasions Completed – Number of completed checklist occasions.
You can also break down the data by unit to compare stores, departments, or other operational areas.
Status Overview
Under Status Overview, you can view a detailed summary of checklist compliance per unit for the selected week or month.
The status is displayed using colors and occurrence counts:
🟢 Green – The checklist was completed.
🟡 Yellow – The checklist was started but not completed.
🔴 Red – The checklist was not completed.
The numbers displayed in each color indicate how many scheduled occasions fall into each category, making it easy to identify units that may require additional follow-up or support.
Under Centralstyrda checklistor får du en snabb överblick över samtliga publicerade checklistor och hur väl de efterlevs ute i verksamheten.
För varje checklista visas en statusindikator baserad på de 7 senaste schemalagda tillfällena:
Adopted – Checklistan används kontinuerligt och har en hög efterlevnad.
Engaged – Checklistan används, men det finns viss förbättringspotential.
Needs Attention – Checklistan har låg efterlevnad och bör följas upp.
Statusen baseras på genomförandet av de senaste 7 schemalagda tillfällena. Om en checklista exempelvis är schemalagd dagligen kommer analysen att baseras på den senaste veckans genomföranden.
Du kan även se:
Aktiva avvikelser – antal öppna avvikelser rapporterade via checklistan.
Status – visar efterlevnaden för checklistans senaste aktuella tillfälle och hur många enheter som har genomfört checklistan. Exempelvis innebär statusen 6/8 att 6 av 8 enheter har slutfört checklistan för det senaste schemalagda tillfället, medan 2 enheter ännu inte har genomfört den.
Genom att klicka in på en checklista får du en mer detaljerad analys på enhetsnivå.
Analys (överblick)
Genom att klicka på analys överblicken uppe till höger får du tillgång till trendanalyser för den valda checklistan.
Här kan du följa utvecklingen över tid och analysera resultat för den senaste veckan eller månaden.
Du kan bland annat följa:
Rapporterade avvikelser – antal rapporterade avvikelser.
Slutförda avvikelser – antal åtgärdade avvikelser.
Genomförda kontrollpunkter – antal slutförda uppgifter kopplade till checklistan.
Genomförda rutin tillfällen – antal genomförda checklistetillfällen.
Du kan även bryta ned statistiken per enhet för att jämföra olika butiker, avdelningar eller arbetsytor.
Status Överblick
Under status överblicken får du en tydlig sammanställning av checklistans status per enhet för den senaste veckan eller månaden.
Statusen visas med färger och antal tillfällen:
🟢 Grön – checklistan har genomförts och slutförts.
🟡 Gul – checklistan har påbörjats men inte slutförts.
🔴 Röd – checklistan har inte genomförts.
Siffrorna i respektive färg visar hur många schemalagda tillfällen som hamnar inom varje kategori, vilket gör det enkelt att identifiera enheter som behöver extra uppföljning eller stöd.
Operational Insights
💡 Trend analysis and insights within Analytics are currently only available in the web version of StoreSprint.
The Leaderboard provides a quick overview of activity levels across your organisation and helps you identify both highly engaged units and areas that may require additional support.
Activity levels are based on a combination of several areas within StoreSprint, including:
Created and completed Tasks
Reported and resolved Issues
Completed checklist control points and routines
General activity related to daily operations in StoreSprint
This provides a clear picture of how different units are working with StoreSprint and makes it easier to follow up on adoption, engagement, and operational execution across the organisation.

Explore Trends & Insights
By clicking into a specific area within Analytics, you can access a more detailed analysis and track development over time.
For example, by selecting Completed To-dos, you can identify trends week-over-week or month-over-month and understand during which periods task completion on the shop floor increases or decreases.
Similarly, you can analyse trends related to Issues, Checklists, and other key areas to:
Identify periods of high or low engagement
Measure the impact of new initiatives or ways of working
Compare performance across regions and stores
Uncover patterns and trends that support better decision-making
By combining the Leaderboard with trend analysis, you gain both a high-level overview and deeper insights into engagement and operational execution across your organisation.
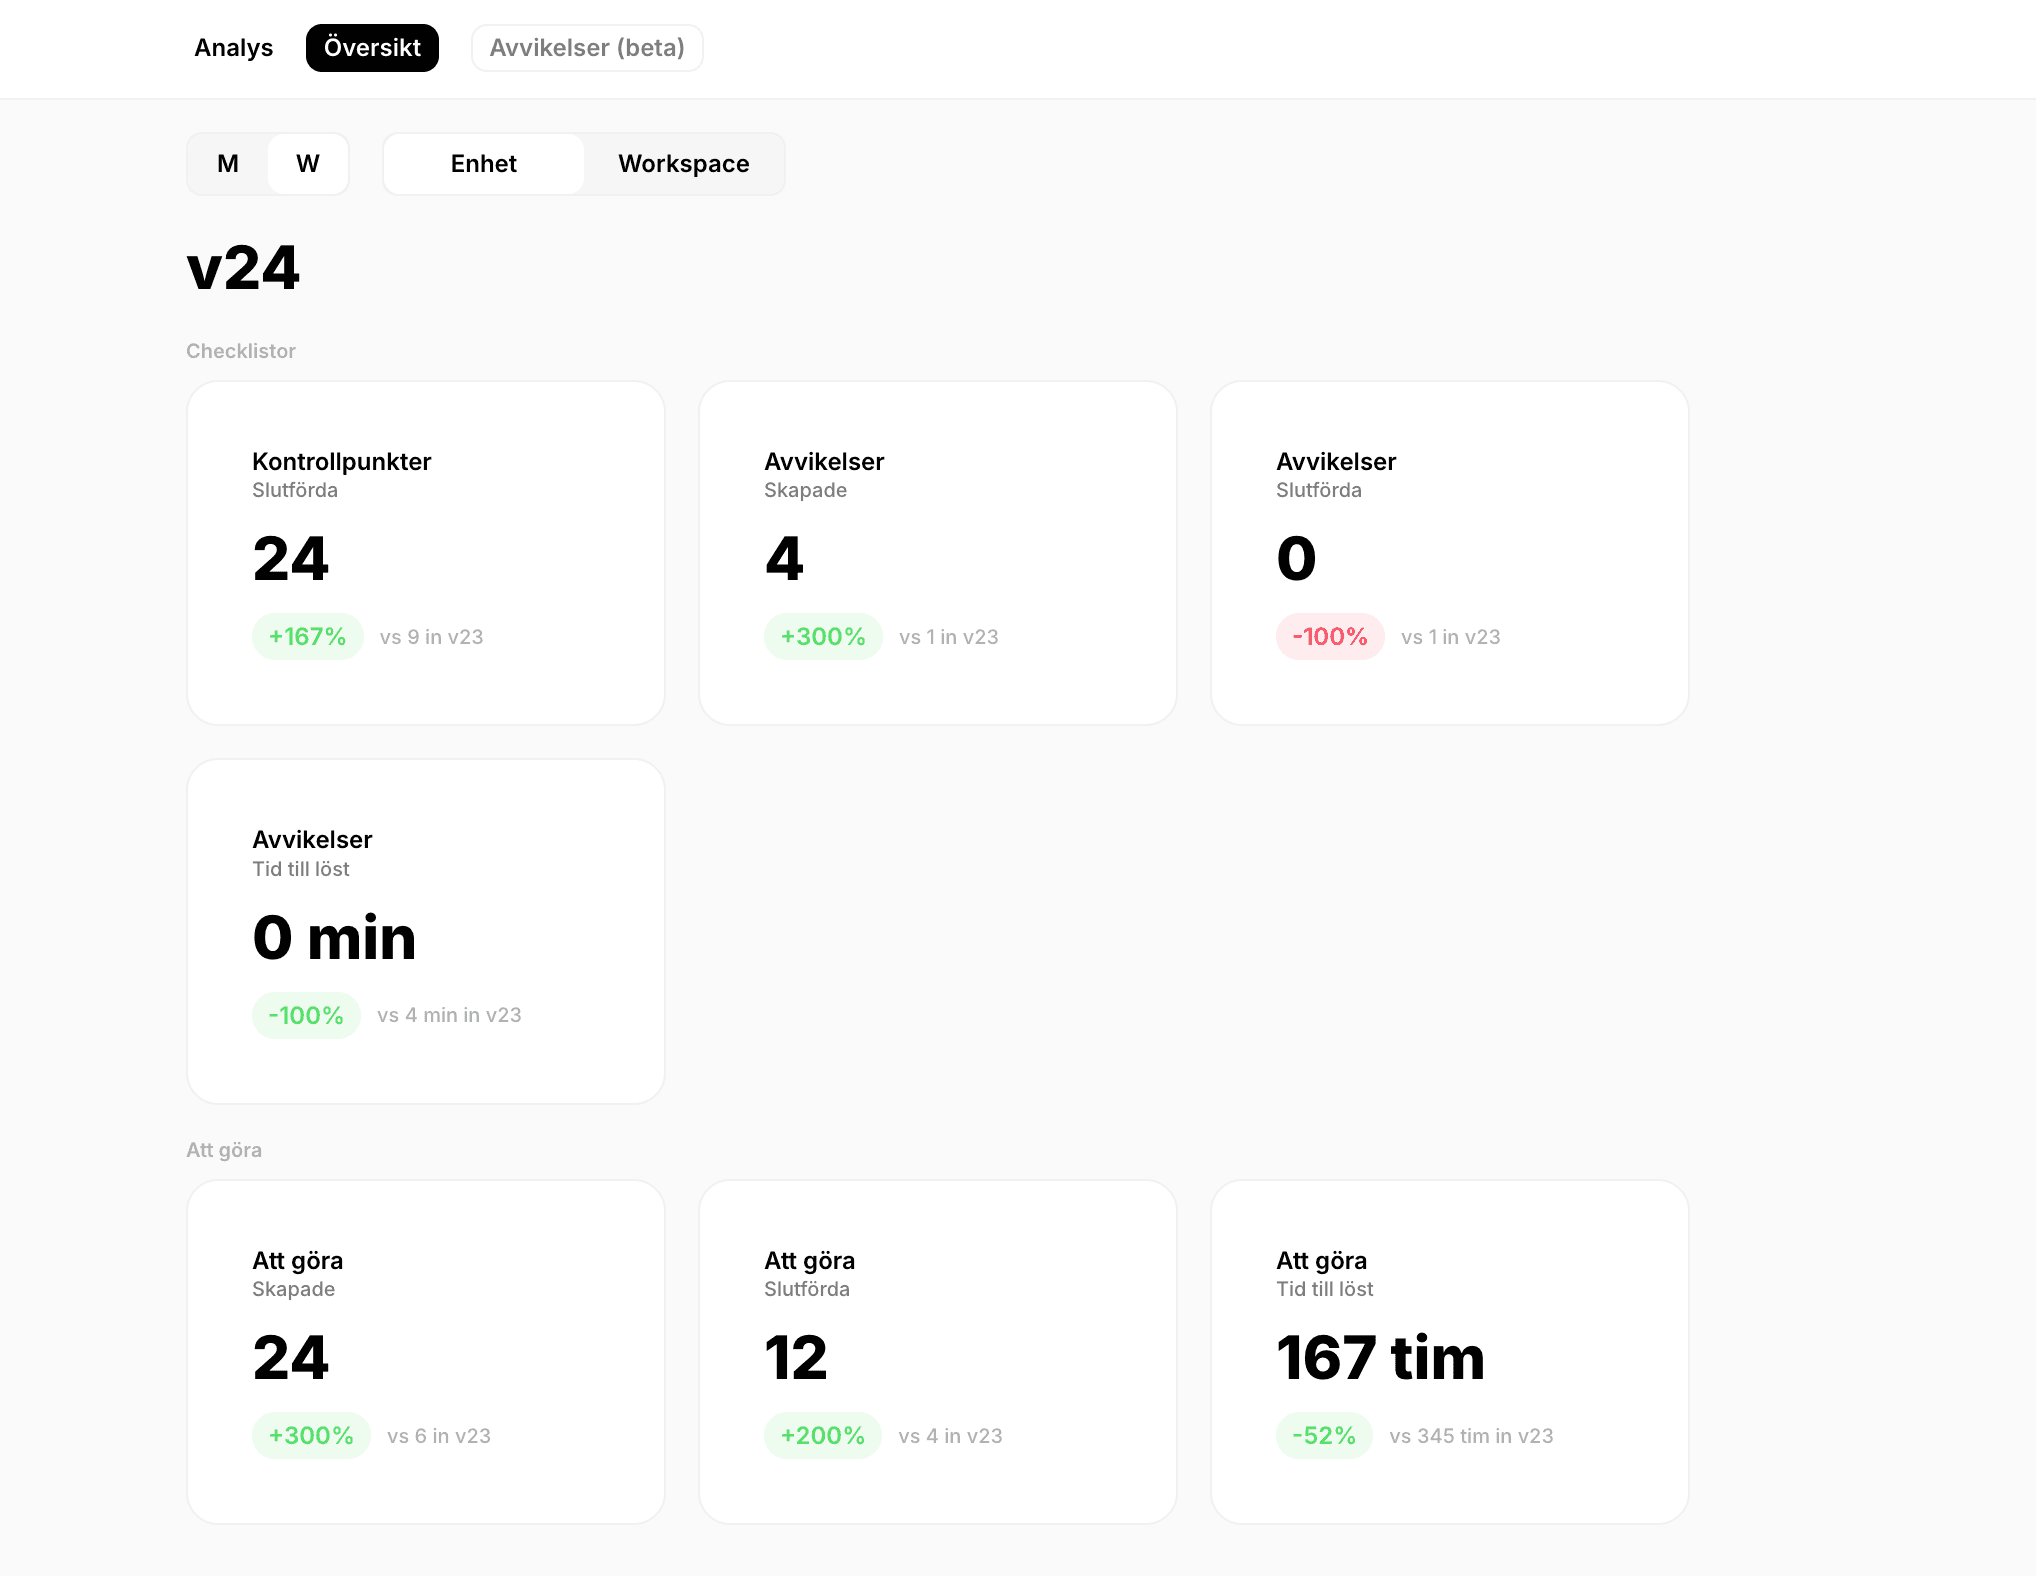
💡 Trendanalyser och fördjupade insikter i Analytics är för närvarande endast tillgängliga i webbversionen av StoreSprint.
Leaderboarden ger er en snabb överblick över aktivitetsnivån i organisationen och hjälper er att identifiera både framgångsexempel och områden som kan behöva extra stöd.
Aktivitetsnivån baseras på en sammanvägning av flera områden i StoreSprint, bland annat:
Skapade och slutförda Att göra-uppgifter
Rapporterade och åtgärdade avvikelser
Genomförda kontrollpunkter och checklistor
Övrig aktivitet kopplad till det dagliga arbetet i StoreSprint
Detta ger en snabb bild av hur väl olika enheter arbetar med StoreSprint och gör det enklare att följa upp implementering, engagemang och efterlevnad av arbetssätt ute i verksamheten.
Trendanalys per område
Genom att klicka in på ett specifikt område i Analytics kan ni få en mer detaljerad analys och följa utvecklingen över tid.
Om ni exempelvis klickar på Slutförda Att göra-uppgifter kan ni se trender vecka för vecka eller månad för månad och analysera när genomförandet på butiksgolvet ökar eller minskar.
På samma sätt kan ni analysera utvecklingen för avvikelser, checklistor och andra nyckelområden för att:
Identifiera perioder med högt eller lågt engagemang
Följa effekten av nya initiativ eller arbetssätt
Jämföra utvecklingen mellan regioner eller butiker
Upptäcka mönster och trender som hjälper er att fatta bättre beslut
Genom att kombinera översikten i Leaderboarden med trendanalyserna får ni både en snabb nulägesbild och ett värdefullt underlag för uppföljning, coachning och kontinuerlig förbättring.