Operational Intelligence
Er Kedja,
Er Intelligens
Världens ledande plattform för butikskedjors drift, driven av Operationell Intelligens.
Sätt er på väntelistan

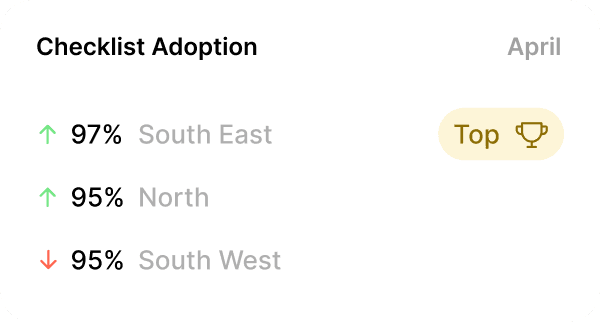
Insikter genom hela kedjan
Identifiera trender automatiskt
Koppla upp dig mot live-data från hela kedjan för att se mönster, upptäcka trender och hitta flaskhalsar, automatiskt.
-18% fewer issues in category
Poor Signage
Recomendations
Increase Staffing Coverage during Peak Hours
Ensure compliance with key routines
Monitor customer satisfaction and queue impact after implementing changes.
Smart bildanalys
Analysera butikens bilder för att upptäcka återkommande avvikelser och visuella mönster mellan olika enheter.
Clean Up
130
Shelf Gaps
67
Poor Signage
122


Enkel uppföljning
Få överblick direkt. Se vad som är gjort, vad som halkar efter och vilka som driver resultat.
Lansera och förbättra det som gör skillnad
Mät effekten av förändringar i driften tillsammans med externa datakällor. Skala upp det som fungerar, justera det som inte gör det.
Benchmarking och kedjeeffekter
Se hur förändringar i driften påverkar olika butiker med hjälp av A/B-tester och jämförelsetal.
Store B (Underperforming)
Sales vs Budget
421,000€
-15%
Differences Compared to High-Performing units
Routine Completion
67%
Staff Per Shift
6 (-25%)
Customer Satisfaction
3.9 ⭐️
Checkout Queue Time
5.8 min avg
Store A (High Performing)
Sales vs Budget
520,000€
+4%
Differences
Routine Completion
92
Staff Per Shift
8 (-25%)
Customer Satisfaction
4.6 ⭐️
Checkout Queue Time
2.5 min avg
Lansera initiativ
Se vad som faktiskt händer när du sätter insatser i rullning.
New Routine Initiative
Updated Version
93 Stores
Completion
92%
Issues
13% Less
Utveckla driften med extern data
Knyt ihop system du redan har för att vässa beslutsunderlaget och agera smartare.

Understaffed
High Sales Demand
130%
Checkout Queue Time
5.8 min avg
Customer Satisfaction
3.9 ⭐️
Ta bort manuellt arbete för
chefer och medarbetare på golvet
Förslag för kedjedriften
Gör det enklare att utveckla kedjan med rekommenderade åtgärder baserat på din data.
Recurring Issues
“Problems With Signs”
321 This Week
Wrong Pricing
Display Missing
Signage Printer not working
Broken sign
Consider adding a recommended routine to work proactively
Signage Review (Weekly)
Add to 34 units
Generera innehåll baserat på din kedja
Skapa instruktioner och rutiner enligt era riktlinjer. Slipp manuellt arbete.
Generate
Generate
Stötta frontlinjen i att agera
Gör rätt saker utan att en chef behövs, med smarta förslag och uppgifter baserat på butikens behov och personaldata.
Recommended Actions
Your Shift
08:30-12:00
Utility Team
Empty Bin At Recycling station
Customer impact: High

Replenish shopping baskets at entrance
Customer flow affected
Fix pricing label mismatch in dairy section
Risk of incorrect sales

Generated Todo
Out Of Stock: Replace Product

Remove Signage and Update Promotion
Replace Empty area with Similar Product in stock
Recommended #31431 Or #12319
Attached Product Info
Out Of Stock
3
Ingen tid att förklara
Få automatiska beskrivningar och taggar utifrån bilder och indata.
Overfilled Bins
Improper Sorting
Obstructed Access
Använd data från flera källor
för att förbättra intelligenta resultat

Idag
Förvandla data till förändring
